RainCloudPlots: shiny app
I created an interactive click interface to easily customize RainCloud plots without writing code.

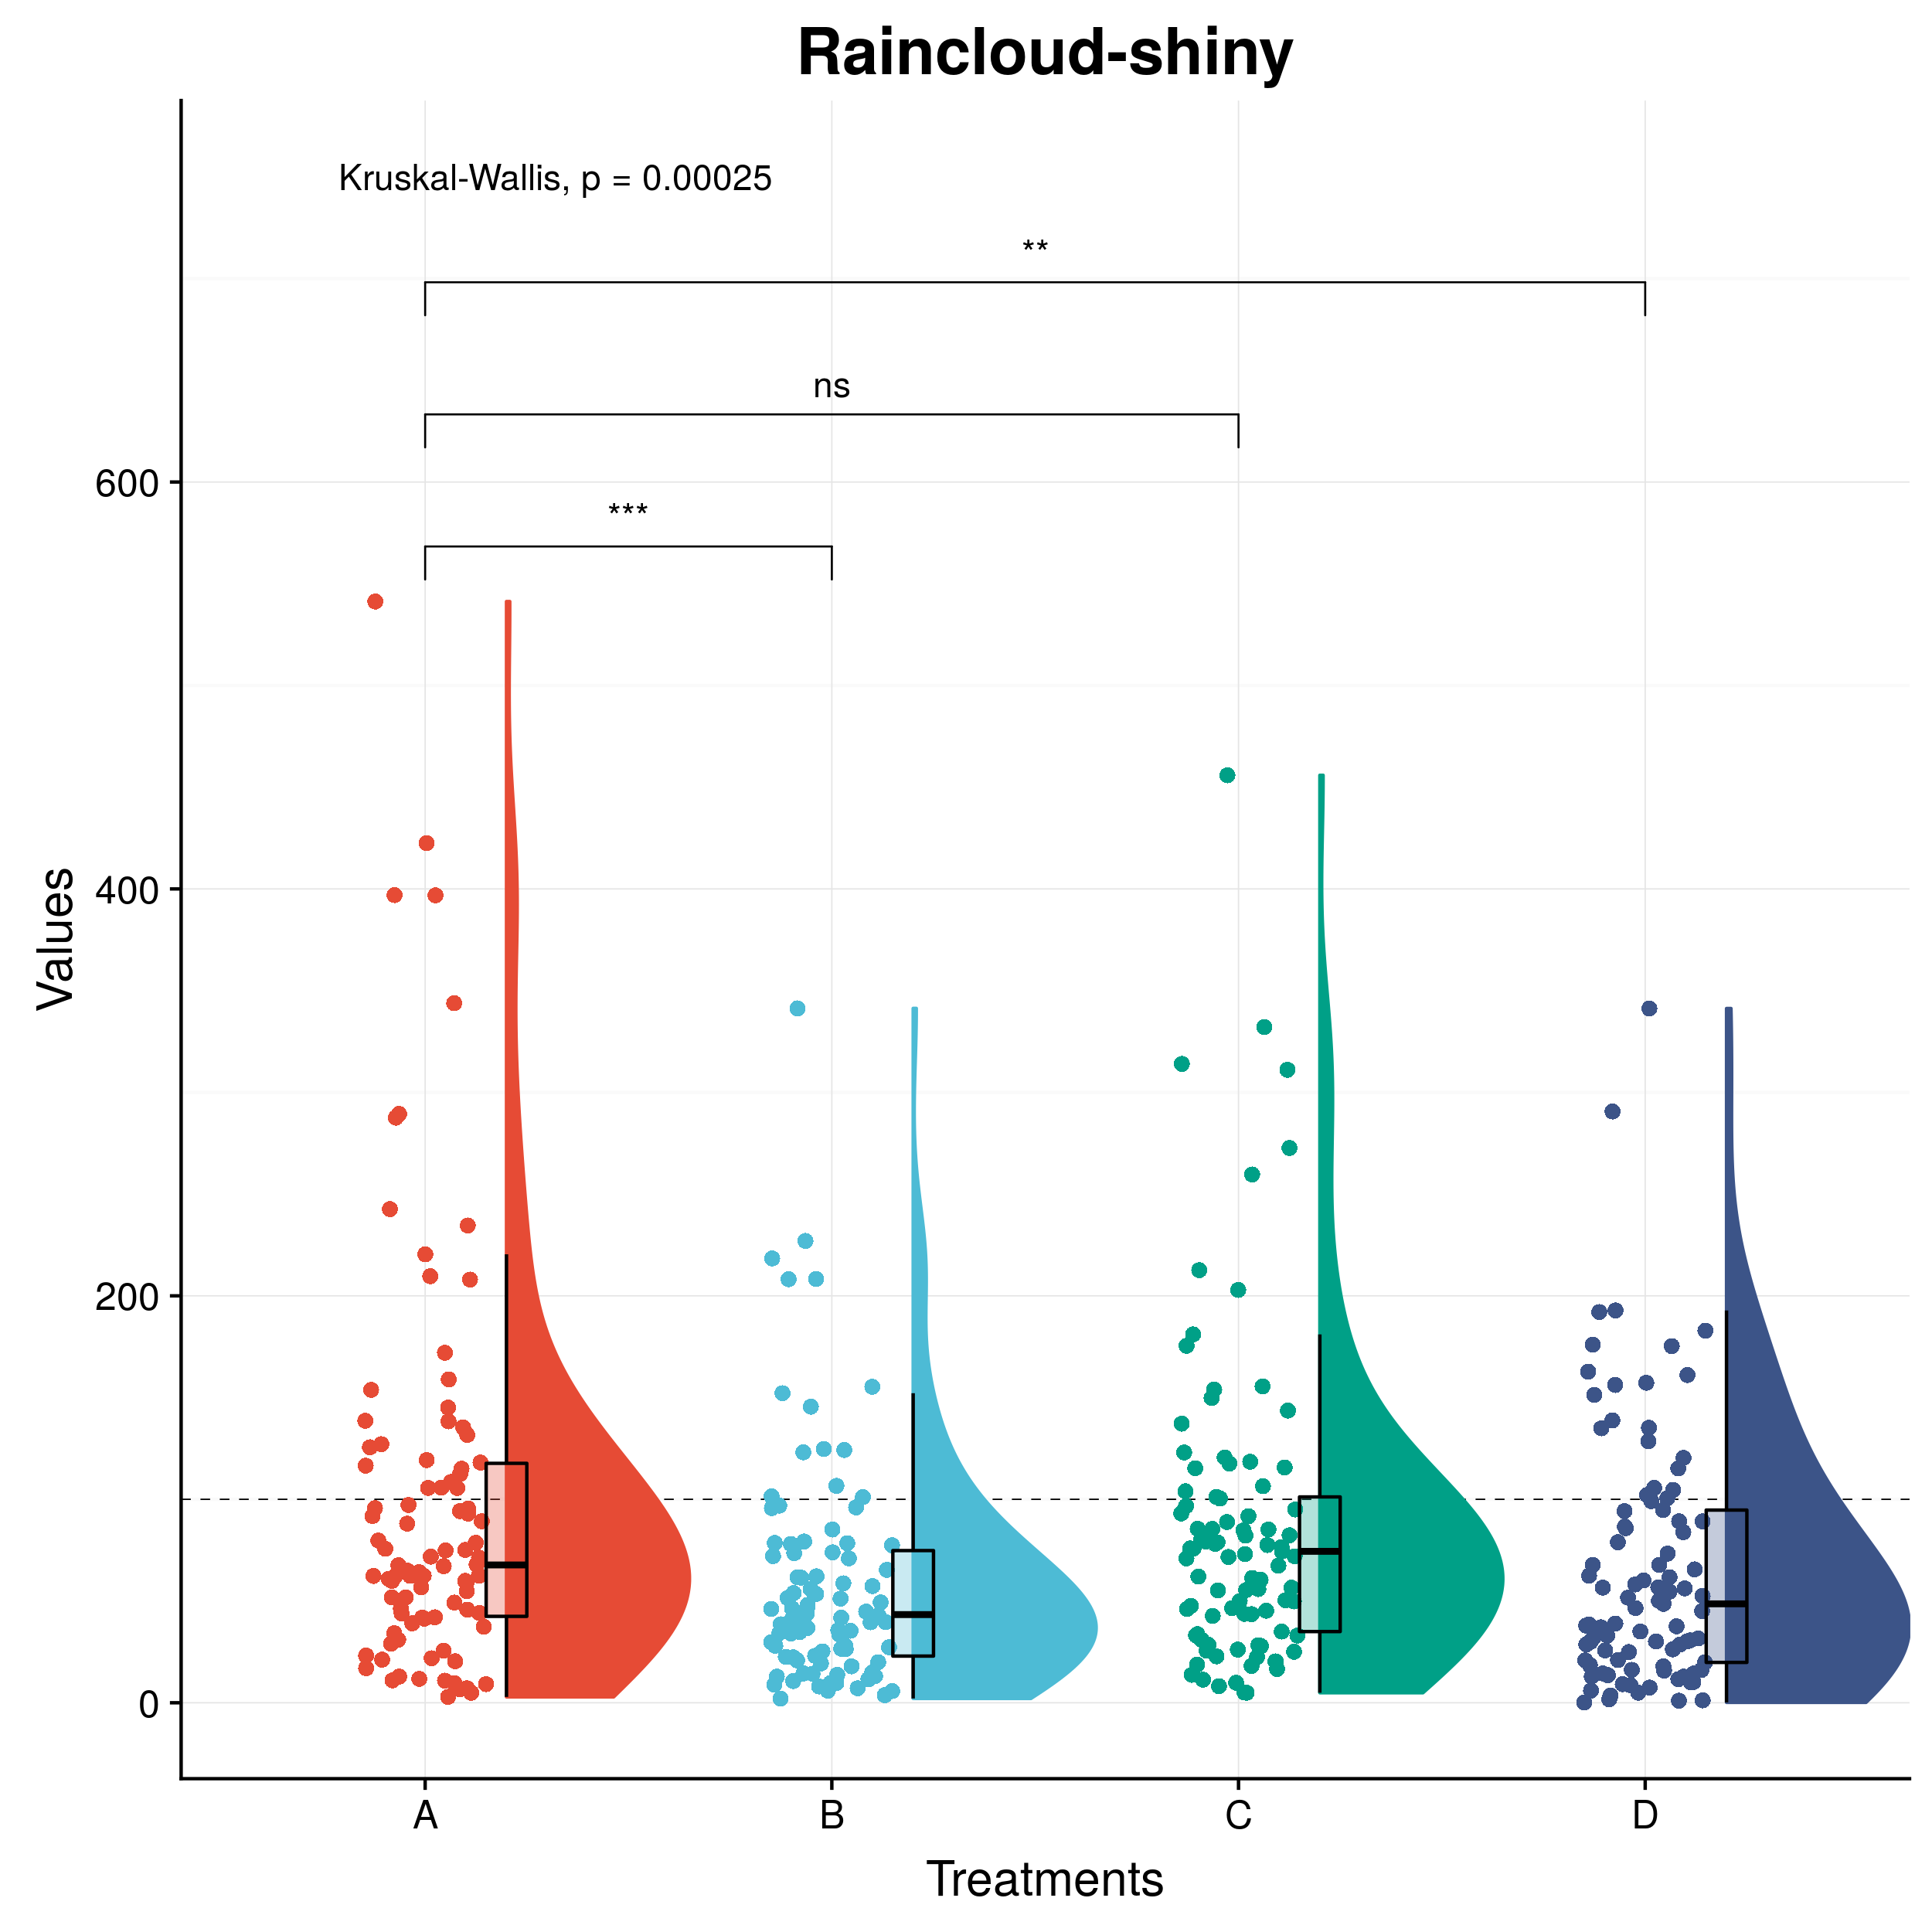
It should provide a nice head-start to know how the ggplot package of R works, or alternatively, a nice click and interactive interface to make nice plots.
In the last few weeks, I have been working on my first public Shiny app. I have been working a bit with R lately and was interested in trying its internet interface. The objective was to decress the entry barrier to R and ggplot to some of my colleagues while keeping it interesting, so I decided to create an app that showed side-by-side a plot with the important code sections relevant to make it plot possible.
After a long debate about it, I decided to tweet and open-source it. The app is now uploaded here, and the I published the source code on Github here.
My coworkers and I found Raincloud Plots by @micahgallen really interesting but did not have enough experience in R to comfortably use the code, so I made a Shiny app. Hopefully you also find it useful. #shiny #rstats #dataviz https://t.co/nvwP0Zj2ry pic.twitter.com/MXL7inquBZ
— Gabriel Forn-Cuní (@furniest) October 9, 2018
The app was well-received, even by the publishers of the original idea, and the overall feedback has been positive, so I am sure that updates and new apps are coming in the near future :)
Fantastic! We'll definitely be adding a link to this in the manuscript! https://t.co/6WxbBwymfG
— neuroconscience (@neuroconscience) October 9, 2018
🐭 quite a week for R ∩ clicky-viz!
— Mara Averick (@dataandme) October 12, 2018
☔ "raincloud-shiny: shiny app for customizing Raincloud plots" by @furniesthttps://t.co/9JU2x2WZl5 #rstats #dataviz #rshiny pic.twitter.com/Oy9kg2lU8x
Please let me know if you use it, if you find it useful, if you find something is missing, or any other kind of feedback.